Did you notice the new Reports tab? If you haven’t already, check it out! Interactive graphs help you see at a glance how your business is doing on key performance indicators. You can choose from a variety of metrics including appointments, new bookings, dollar value, and hours booked.
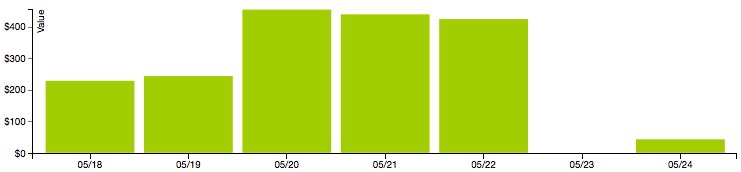
By default, the bar chart shows total appointments by day for the current week. Each column represents a time period; you can change the interval to group by day, week or month. You can change the timeframe too to see trends over longer periods like four to thirteen weeks or even a full year. Best of all, you can look forward and see what’s booked in the future.
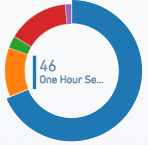 The pie charts at the top give you a detailed breakdown by service, booking type (by clients online or by staff offline), status (no-show or completed), and staff/location. Just move your mouse over a pie slice to see the details. You can also filter the graphs to show data for just a specific service, booking type, status, or employee.
When you change any of the settings, all of the graphs and tables update instantly. You can export that data to a CSV (comma separate values) file that you can open and analyze further in a program like Excel, or print a pretty report that looks just like what you see on the screen.
We’re really proud of this feature. It was inspired by the reports in QuickBooks and built by a developer from Intuit. Just the beginning of many great new things to come!